Monitors
A monitor is a sampling configuration — one brand, one market, a set of engines and prompts, collected on your plan's cadence — with per-engine tiles, a heatmap, and receipts.
A monitor is a sampling configuration: one brand × one market/locale × a chosen set of engines × an optional persona × a set of prompts, collected on your plan's cadence. The "engines" are the ten AI answer surfaces MentionFlow samples.
What it does
Each monitor is one running experiment against the AI answer engines. It defines what is asked, where (which market and persona), and on which engines, then collects answers on your plan's cadence so every prompt in it accrues a run history you can audit.
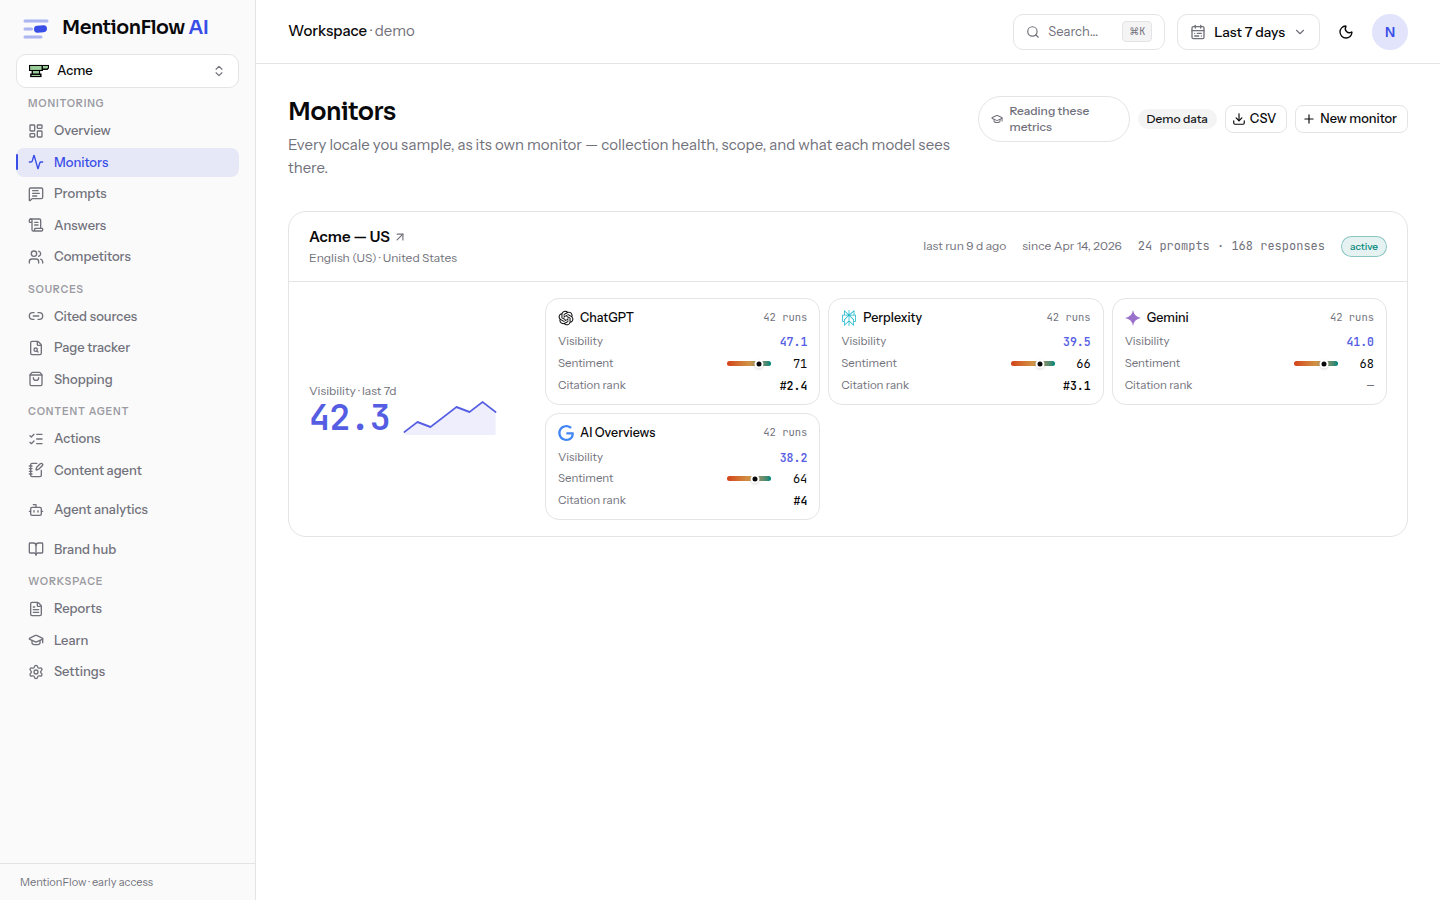
The monitors list shows a card per monitor with:
- A visibility figure and sparkline.
- Per-engine tiles for the engines that monitor collects.
- A status chip — one of paused, awaiting first run, stale (>36h), or active.
How to use it
Create a monitor. "New monitor" is a two-step wizard:
- Market and persona. Pick a market from nine regions and, optionally, a persona.
- Engines and prompts. Pick engines from your plan's slots — the picker mirrors your usage exactly, so you can never select a slot you don't have. Then keep or edit roughly 12 LLM-suggested prompts (at least eight unbranded, written in the market's language) with a live quota meter beside them.
Nothing is written until you press Create — the whole draft is client-side until then.
Work a monitor. The detail view is tabbed:
| Tab | What it holds |
|---|---|
| Overview | The monitor's headline metrics |
| Prompts | The prompt set attached to this monitor |
| Responses | The answer table (capped at 200 rows) |
| Sentiment | Scored mentions, banded by index |
| Citations | The sources cited in this monitor's answers |
| Heatmap | Per-entity, per-engine visibility |
| Settings | Pause / resume / delete |
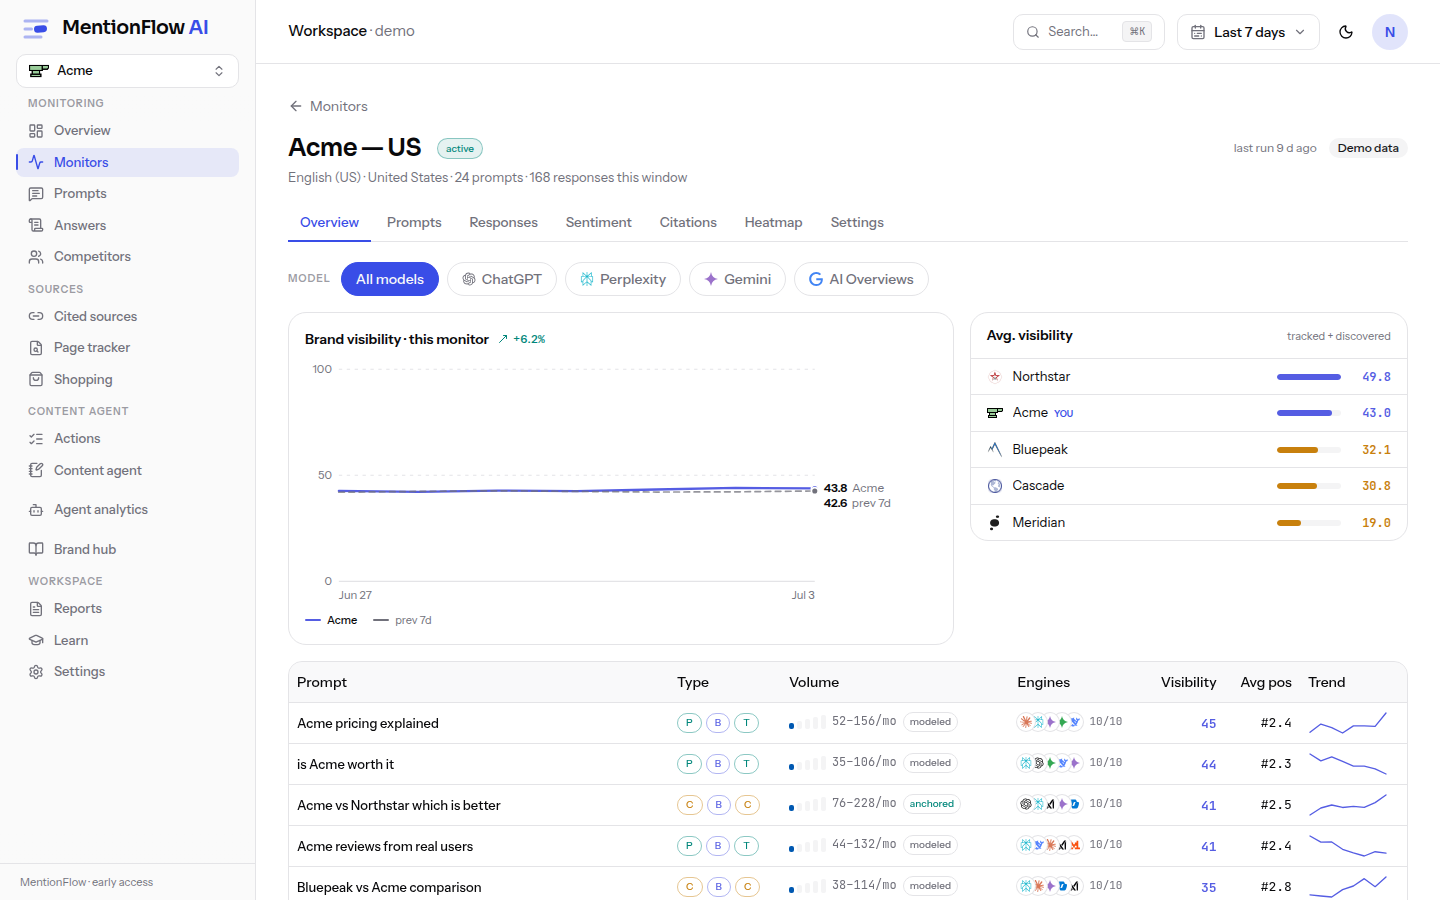
Sentiment bands the index as ≥60 Positive, ≥45 Neutral, and otherwise Negative. A ?model= filter you set on one tab persists across the tabs.
A brand must keep at least one monitor. Deleting a monitor re-homes its prompts to the oldest remaining monitor rather than dropping them — their history is preserved.
How it's computed
Each engine maps to a production adapter, and the adapters differ in how they reach the answer:
| Engine | How it's sampled |
|---|---|
| ChatGPT | Managed consumer-chatgpt.com scrape, ads stripped |
| Perplexity | Managed scrape or the Sonar API |
| Gemini | Managed scrape or DataForSEO |
| Google AI Overviews | Google SERP sampling |
| Google AI Mode | Google SERP sampling |
| Copilot | Managed scrape |
| Claude | Anthropic API + web-search tool |
| Grok | xAI Live Search |
| DeepSeek | Direct API, no web search |
| Mistral | Direct API, no web search |
DeepSeek and Mistral answer from model knowledge only, so their citations are honestly empty — not a bug, just the truth about a knowledge-only engine.
A monitor card's visibility includes every engine that monitor collected, including the knowledge-only ones. This is an intentional deviation from the blended headline on Overview, because the card is describing that monitor, not the blended figure. The data-honesty page names every place denominators differ on purpose.
Two more computed surfaces:
- The heatmap cell is per-(entity, engine) visibility over the whole monitor window, and it ignores the
?model=filter so the grid stays comparable across engines. - The leaderboard auto-discovers untracked names mentioned in at least two answers (top 12), so rivals you never entered still surface.
Limits
- Engine slots, cadence, and Claude access are plan-controlled — see Plans and quotas.
- Nine markets are available on every plan.
Related
- Answers and receipts — the individual runs a monitor collects.
- Plans and quotas — engine slots, cadence, and Claude access.
- Visibility — the metric on every monitor card.
- Core concepts — where a monitor sits in the data model.